
Why compare these three micro‑markets?
With Egypt’s Red Sea coast cementing its status as a year‑round playground for Europeans and Gulf buyers, the question is no longer if you should hold seaside real estate, but where you should diversify. 2025 brings distinctly different risk‑return profiles in Soma Bay, El Gouna and Sharm El Sheikh—three destinations separated by fewer than 380 km of shoreline yet worlds apart in maturity, liquidity and price momentum.

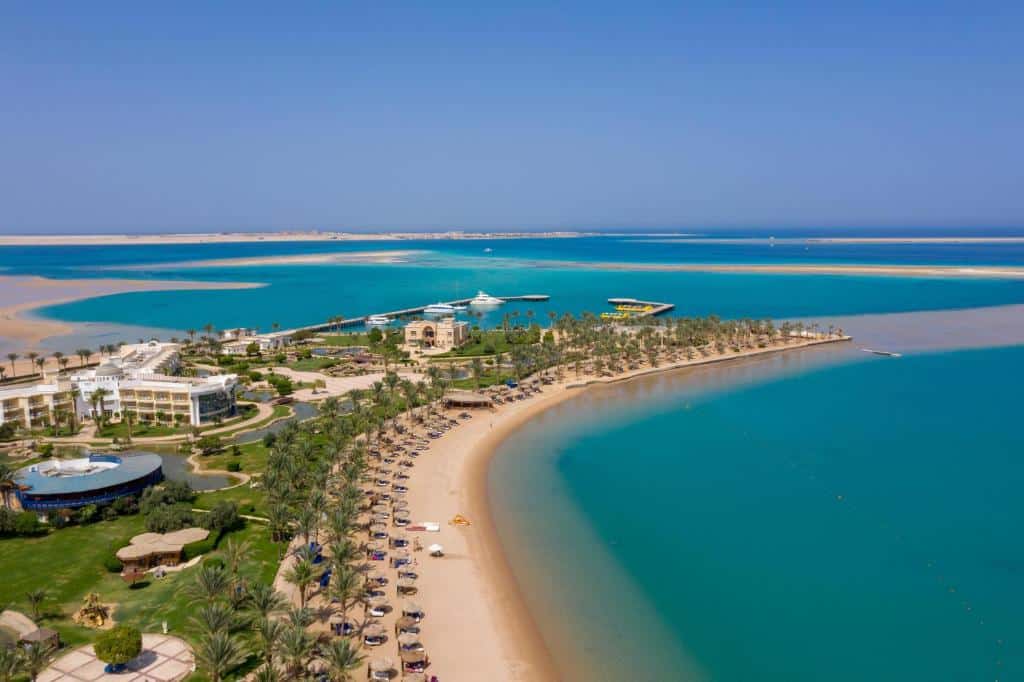
1 | Soma Bay – the “emerging luxury node”
| Snapshot | |
|---|---|
| Growth driver | $1 billion masterplan refresh: Anantara hotel, co‑working hotel, solar plant, 2,000 new homes |
| Pricing 2025 | ~EGP 56,000 /m² for branded lagoon stock (≈ US $1,200) – still 25‑30 % below El Gouna’s prime launches |
| Liquidity | Limited resale supply; developers releasing inventory in small tranches keeps upward price pressure |
| Rental thesis | Golf/kite‑surf crowd; shoulder‑season occupancy strong; yields 6‑7 % gross on short‑lets |
Soma Bay sits on a narrow peninsula south of Safaga, meaning every plot is either beachfront or second‑row. The Arc of Soma ‘Lagoon Edition’ and Bay Central phases are accelerating absorption: first‑day launches in March sold out in hours. Investors betting on infrastructure love the Ras Soma dual-carriageway and the Hurghada airport PPP, which slashes transfer times to under 45 minutes.
Risk to watch: a single‑seller market (fewer independent resales) can exaggerate short‑term volatility if Europeans abruptly slow purchases.
2 | El Gouna – Egypt’s most mature, premium‑priced resort city
| Snapshot | |
|---|---|
| Growth driver | 35‑year track record, international schools, hospital, film festival, two marinas, self‑governing utilities |
| Pricing 2025 | New‑launch median ≈ EGP 70,000 /m²; resale averages now exceed EGP 200,000 /m² in lagoon districts |
| Liquidity | Deep secondary market; Orascom delivered 96 units in Q1 2025 alone |
| Rental thesis | High ADR, but yields compress to 5‑6 % because of loftier entry prices |
El Gouna is effectively a privately run “town”; buyers pay a premium for governance, amenities, and walkability. The Tuban mixed‑use district and higher‑priced launches (EGP 279 k /m² headline in Q1 2025) confirm its blue‑chip status. That strength, however, limits capital‑upside acceleration; think of El Gouna as a bond proxy: stable, liquid, but less explosive.
Risk to watch: premium entry cost and rising association fees can erode net yield; limited plots left for large‑scale future supply.
3 | Sharm El Sheikh – value‑oriented, cash‑flow play
| Snapshot | |
|---|---|
| Growth driver | Wide occupancy swings (31‑46 %); headline yields 7‑9 % in peak month,s but highly seasonal |
| Pricing 2025 | Avg apartment price ≈ EGP 23,600 /m²; villa land as low as EGP 6,750 /m² – a 60‑70 % discount vs. Soma Bay |
| Liquidity | Large stock, frequent listings; buyers can cherry‑pick distressed or developer‑financed units |
| Rental thesis | Wide occupancy swings (31‑46 %); headline yields 7‑9 % in peak month, but highly seasonal |
Sharm’s appeal hinges on scale: two international marinas, year‑round diving, and the most extensive hotel room inventory on the Red Sea, for second‑home investors, which translates into easy flight connectivity but also deeper competition in the short‑let market. RE/MAX’s 2025 franchise arrival signals institutionalisation of resale channels—good for exit liquidity.
Risk to watch: price corrections are sharper (–8 % y‑o‑y in June 2025), and reputational events (e.g., geopolitical headlines) skew demand quickly.
Portfolio construction: sample allocation scenarios
| Investor profile | Objective | Suggested mix |
|---|---|---|
| Lifestyle‑first executive | Holiday home you’ll actually use + moderate capital gain | 60 % El Gouna (ready), 40 % Soma Bay (rising luxury) |
| Yield hunter | Maximise cash‑on‑cash in five years | 50 % Sharm (value‑add STR), 30 % Soma Bay (mid‑cycle), 20 % El Gouna (liquidity buffer) |
| Capital‑appreciation fund | Long‑term IRR >12 % | 70 % Soma Bay + Ras Soma land bank, 30 % Sharm pre‑handover villas |
Key take‑aways
- Don’t over‑allocate to one postcode. Price cycles and tourism flows differ markedly across the Red Sea.
- Watch the airports. PPP upgrades to Hurghada and Sharm, plus Red Sea Intl. runway two, will redraw arrival funnels and property values over the next 36 months.
- Factor in the actual cost of ownership. Service charges in El Gouna can reach US $6 /m²/month versus ~US $3 in Soma Bay and ~US $2 in Sharm.
- Exit strategy matters. El Gouna’s secondary market clears fastest; Soma Bay’s is growing; Sharm rewards patient sellers or hotel‑conversion plays.
Final word
A well‑balanced second‑home portfolio in Egypt today blends El Gouna’s blue‑chip stability, Soma Bay’s growth runway, and Sharm El Sheikh’s yield advantage. Allocate according to your liquidity horizon—and remember that “location, location, diversification” is the new mantra for coastal investors in 2025.


Join The Discussion